
NFL
Philadelphia Eagles vs. San Francisco 49ers Preview

[ad_1]
We have the definitive guide to the numbers behind the NFC Championship Game between the San Francisco 49ers and Philadelphia Eagles. We explore nearly every analytical angle to the game and dive deep into the unique features of each offense and how they relate to the opposing defense.
With the Super Bowl on the line, the NFC Championship Game has produced two statistical darlings in the 49ers and Eagles, who have come about their success in two very different ways. Let’s break it down.
San Francisco 49ers vs. Philadelphia Eagles Behind the Numbers
49ers vs. Eagles Team-Level Statistics
Mobile Users: Table best viewed in landscape. Use fingers to scroll.
These various team-level statistics take the net result of each performance — offensive expected points per play is subtracted from defensive expected points per play, and so on. The outcome here tells us that these are two well-matched, high-performance teams.
The first three statistics are per play, and two of them are indexed off of expected points. Expected points look at the average points scored from a particular down, distance, and field position, and subtracts the difference between two plays to determine how many expected points were added between those plays.
It does a great job predicting NFL outcomes and can help us explain which teams have helped themselves the most with particular types of plays, like how some interceptions hurt more than others because they occurred deep downfield on third-and-long, instead of in the flat on 1st-and-10.
MORE: NFL Power Rankings Championship Round
Success rate evaluates what percentage of plays gained expected points. Any play that added to the total counts as a success, while plays that reduce expected points are not. This is a good proxy for consistency because it tells us whether or not a team can, from play to play, accomplish their goals instead of relying on fluke plays like a busted coverage or tipped interception.
EPA per play takes the average expected points gained over the course of a game and divides it by the number of plays.
Explosion rate looks at how often a team creates an explosive play, which is defined as 16 or more yards through the air or 12+ yards on the ground.
In these per-play statistics, the Eagles and 49ers are about even, though San Francisco comes out ahead in success rate and EPA per play and just a tick behind Philadelphia in explosion rate.
The next three statistics are drive-level instead of play-level. Drive-level statistics, in many ways, are more useful than play-level statistics. It is not the goal of any offense to score on every single play, but it is the goal of offenses to finish their drives with a score. Not only that, drives represent true opportunities.
If a team scores four times in 10 drives, they have left their opponent more drives — about 10 — to respond and rack up points. But if they score four times in five drives, they’ve only left about five opportunities on the table.
Four touchdowns in a five-drive performance is exceedingly efficient. Those 28 points are much more meaningful and likely to win the game than four touchdowns in a 15-drive performance, where the opponent had 15 opportunities to match or beat that number.
“Drive Success Rate” refers to the ability of an offense to generate first downs (or for a defense to stop them). It takes the number of first downs (and touchdowns) generated on a drive and divides it by the number of down series an offense had.
A team that generates two first downs and then kicks a field goal would have a success rate of 66.7%, while a team that generates one first down and then scores a touchdown would have a success rate of 100%.
These drive-level statistics are where San Francisco really shines, ranking ahead of Philadelphia in all. They generate and stop first downs more often, generate and stop more points per drive, and have the highest net-scoring percentage in the league, forcing punts or turnovers more often while avoiding those themselves.
None of this is to say that the Eagles are bad at any of these measures. They’re among the best in the league. But the 49ers really stand out here.
The next four are per-game statistics. Three of them are adjusted for strength of competition. Point differential, calculated per game, favors the 49ers. While the rank differences are small, the absolute difference is fairly large.

The 49ers seem to be a tier above the Eagles in this category, who themselves are a tier above the Jaguars, Ravens, and Lions. But there are reasons to hesitate with this. Philadelphia has had a slightly more difficult schedule than San Francisco, though the differences are somewhat marginal. Still, correcting for that gives us what Pro Football Reference calls “SRS,” or Simple Rating System.
It takes point differential and compares it to the average expected point differential based on a team’s schedule. Then, for each team, it does that again using the new average value. And again, and so on, until the changes from run to run are small.
That closes the gap between the two, but it’s not enough to flip it in the Eagles’ favor. Game Script, which also uses points, does do that, however.
Instead of looking at the score at the end of the game, Game Script takes a look at the score for every second of every game, taking the average point differential across all time played. That produces a more granular measure that accounts for garbage time. It rewards teams for dominating early and throughout the game and captures back-and-forth games that end up looking less like the close contests they were.
It has its own problems but generally predicts future outcomes better than point differential and can be adjusted for opponent in the same way, as done here. The Eagles’ penchant for scoring early and preventing big scores puts them just slightly ahead of the 49ers, who tend to pull away late in games they end up winning.
DVOA is both a per-play and per-game metric. It accounts for both success rate and explosiveness rate but adjusts for opponents on a per-game level to give us a season-long score. It officially stands for “Defense-adjusted Value Over Average,” where defense just means opponent. Again, at this more granular level, the 49ers are just barely ahead of the Eagles.
When the Eagles Have the Ball
Mobile Users: Table best viewed in landscape. Use fingers to scroll.
Philadelphia here profiles like a team focused more on consistency than explosiveness, though are excellent at both. They find ways to make first downs and drive down the field. Compared to other top-five scoring teams, the Eagles have a bit of trouble finishing those drives and would need slightly better performance.
It’s not that Philadelphia is bad in the red zone, punts very often, or generates a lot of turnovers. They’re just slightly worse at those types of finishing statistics than the top offenses in the NFL.
The 49ers are good at forcing punts but are not uniquely skilled at it. They rank sixth in opponent drives ending in a punt. But they are one of the few teams that have a high punt rate and high turnover rate, ranking second in the NFL in forcing opponent turnovers per drive.
The Eagles are good in all of these categories, ranking third in red-zone efficiency, 10th in turnover avoidance, and fourth in punt avoidance.
MORE: 3 Philadelphia Eagles Keys to Victory vs. the San Francisco 49ers in the NFC Championship Game
The two fulcrum points for how these units perform, then, will be in turnovers and red-zone performance. As far as relative strengths and weaknesses go, the 49ers are somewhat weak compared to the Eagles in preventing touchdowns once teams cross the 20-yard line, while Philadelphia is somewhat more turnover-prone than their peers on the way there.
The biggest problem is that both of these elements are somewhat volatile and hard to predict for individual games. While measures like success rate, EPA per play, and DVOA do a good job of predicting game performance, turnover production and red-zone performance are both somewhat unsustainable.
Teams good at forcing turnovers and avoiding turnovers will generally continue to be good at it. But the best teams in those categories are very unlikely to continue to produce at a top-three rate, and they generally regress to an above-average overall performance.
Same with red-zone production. You do a better job predicting TD rate if you approximate how many times teams get into the red zone rather than how often they score once they get there.
Eagles’ Passing Offense vs. 49ers’ Passing Defense
Mobile Users: Table best viewed in landscape. Use fingers to scroll.
In the air, the Eagles profile as a team that is relatively efficient and gets most of its damage done through explosive plays. They don’t press for those plays, however, and will pick and choose their moments for deep shots.
When things aren’t there, Jalen Hurts can scramble, providing the passing game with a floor in terms of production. That’s why the deep-ball rate can be middle-of-the-pack, and the average depth of target can be just a little bit higher than average, but the overall production in EPA per play and yards per dropback can be so high.
Generally speaking, if the deep ball isn’t there, they don’t force it and either throw it intermediate or scramble. That tendency to scramble is one reason that the sack rate is so high, but the overall production has generally been worth it on offense. That risk aversion with a high floor also means their turnover rate on offense has been low.
This gives Philadelphia a decent success rate, but it primarily means they rely on explosives. Their explosion rate on dropback passes is second in the NFL, and their yards per attempt on deep balls is No. 1 in the league. The Eagles live and die by those explosives and just pepper in enough success to keep the chains moving.
This might also explain why their scoring rate isn’t up there with the league’s best. Philadelphia lives in volatile plays and hopes the plays in between explosives can do enough to keep the chains moving. It generally does that but not at the rate of elite offenses.
On the other side of the ball, the 49ers’ passing defense also lives in volatility. They give up a fair bit of yards per attempt, which happens almost exclusively on deep balls. They prevent those deep balls at a good rate, which is why their success rate is so high from down to down. But when offenses see an opportunity, it’s usually profitable to take it.
For the most part, however, offenses checkdown. That’s why San Francisco can be merely above average in yards allowed per dropback but sixth in success rate. The completions and yards are often empty against them. As evidence, they have the league’s best success rate on completed passes — only 65.6% of opposing completions help the offense. The NFL average is 72.7%.
Still, it’s a fair amount of yards to give up, and the deep shots can hurt. In order to make up for this, the 49ers have one of the highest turnover rates in the league.
Ultimately, this means that they’re about league average at preventing explosives. They deter attempts at a high rate but see a high rate of the ones that are actually attempted succeeding but gain that ground back with their own explosive plays, usually turnovers.
Both teams have a fairly risky profile in this regard, and we should see big plays whenever Hurts drops back to pass, whether that helps the Eagles or hurts them.
Eagles’ Running Offense vs. 49ers’ Running Defense
Mobile Users: Table best viewed in landscape. Use fingers to scroll.
Here we see two titans clash. The Eagles are an incredibly good rushing team, and the 49ers are very good at stopping the run.
Philadelphia doesn’t get as many yards per attempt rushing the ball as many other teams, but that isn’t that meaningful. A rush for two yards on 3rd-and-1 is worth a lot more than a rush for six yards on 1st-and-10.
They’re first in the league in success rate, expected points added per play, and DVOA. They rank third in first-down rate, fourth in fumble rate, and have a league-average rate of tackles for loss. The only thing the Eagles don’t have are explosives, and those are less important in the run game than success rate.
Some of that has to do with a high run rate on third downs (29.8% of all third-and-shorts, second in the league), which includes quarterback sneaks. Some of it has to do with Hurts protecting himself with slides instead of always trying to get more yards.
The fact that they don’t fumble the ball is critical, too.
On the other side of the ball, the 49ers do a great job creating tackles for loss and fumbles, preventing third-down conversions, and preventing successes. They can load the box with run-capable defenders and do a fantastic job making life difficult in downs that should be easy for the offense.
This is how San Francisco can get away with having “only” an above-average passing defense reliant on turnovers — when teams get to “third and manageable,” they have difficulty converting.
This is perhaps a big reason why coaches are more interested in a strong running game than many analysts. Critical moments will often come down to a rushing attempt, and the 49ers are incredible at stopping those attempts.
The big question will surround their ability to stop QB runs. In those critical moments we just identified, the quarterback sneak is going to be the centerpiece of the conversation. Much will hinge on whether or not they can generate movement against the Eagles’ well-designed sneak, which not only relies on Hurts’ powerful legs but their willingness to use the current interpretation of the NFL rules that allow pushing the runner.
Outside of the sneak, they have to prepare for the fact that the Eagles run the quarterback the second most in the NFL as a percentage of all plays. Over one in seven Philadelphia plays will be a QB run of some sort. And they’re successful. The 49ers have a great traditional run defense but have struggled in their limited attempts to stop quarterback runs.
As we saw in the Giants-Eagles games, this is a completely different style of defense and demands particular attention, especially given how efficient it can be. On the other side of the ball, we have a different type of ball game — one that’s as volatile but in a completely different and somewhat unexpected way.
When the 49ers Have the Ball
Mobile Users: Table best viewed in landscape. Use fingers to scroll.
These are also two above-average units. The 49ers practice a slightly different kind of offensive volatility. Instead of heaving deep shots and hoping that a combination of skill and luck prevents turnovers, they throw short passes and rely on defensive positioning and offensive after-catch talent will produce explosives.
That results in a low turnover rate and a somewhat low (relatively) success rate but a high average in terms of expected points, success, and points per drive. Part of this is the third-best turnover rate on drives in the NFL at 9.1%, but part of it is a somewhat high TD rate.
Helping them is the NFL’s best starting field position on drives. On average, San Francisco starts from their own 32.2-yard line. That’s two yards better than the second-place Patriots and four yards better than the league average.
The 49ers have a low rate of punts and turnovers, which means their scoring rate is reasonably high, even though it’s not anywhere near the league’s best. They kick field goals at a league-average rate and score touchdowns at a somewhat high rate. However, that has more to do with exciting after-catch runs than it does efficient red-zone play. San Francisco is roughly league average in red-zone conversion rate and below average in goal-to-go efficiency.
The 49ers are a touchdown team. They rank sixth in touchdowns per drive and third since they traded for Christian McCaffrey, which is about the same span of time they’ve had Brock Purdy at the helm.
MORE: 3 San Francisco 49ers Keys to Victory vs. the Philadelphia Eagles in the NFC Championship Game
This doesn’t mean they go for it very often on fourth down. In fact, they have one of the lowest rates of fourth-down go rates in the NFL, yet they convert first downs at an efficient level. Additionally, San Francisco ranks sixth in both drive success rate and third-down conversion rate.
The Eagles, for their part, seem built to stop offenses in the same way. They have the 11th-best defensive success rate, sixth-best expected points allowed per play, and prevent explosive plays at the fifth-best rate in the NFL.
On a per-drive level, they’re a little bit weaker, and a lot of that has to do with their third-down conversion percentage, which is at league average. Philadelphia forces teams to third down fairly often but don’t always get them to punt once they’re there. Still, they prevent scores, and a good reason for that is similar to the 49ers’ approach — they get the ball.
The 14.9% turnovers per drive rate is third in the NFL, just behind the 49ers’ defense. The game on this side of the ball will likely come down to San Francisco’s ability to establish explosives outside of the deep-ball game and continue to avoid turnovers.
49ers’ Passing Offense vs. Eagles’ Passing Defense
Mobile Users: Table best viewed in landscape. Use fingers to scroll.
The 49ers don’t throw the ball with much depth and don’t throw deep very often. When they do, they’re not all that successful compared to other teams.
That’s just fine with the Eagles, who prevent deep passes at the fifth-best rate in the NFL. But they’re just average when those passes are thrown. In this case, it seems like the two styles of play are cohesive more than anything else; the game will be played short more than anything else.
San Francisco has feasted on opposing defenses with excellent after-catch performances. As a result, they’ve done an excellent job moving the chains, stringing together success after success. That’s how they stay ahead of most offenses, even as they do it differently than everyone else.
It should come as no surprise that the 49ers are one of the most YAC-dependent teams in the NFL. On all passing plays, 58.1% of their passing yardage comes on yards after the catch (second most in the NFL).
For receivers who are targeted more than five times a game, San Francisco ranks first in YAC proportion, 53.3% of those passing yards come after the catch. They’re the only team to crack the 50% mark.
Meanwhile, the Eagles have given up the 11th-largest proportion of their defensive passing yards on after-catch plays. This could imply that Philadelphia is a poor YAC team, but two things need to be taken into account.
The Eagles don’t give up very many yards in general, and they force short passes. By yards-after-catch per reception, they rank 10th in the NFL. And that’s not the whole YAC story.
Philadelphia is great at forcing short passes, and those are the ones with the highest yards after catch. If the Eagles force two-yard passes that get tackled after four yards of after-catch play, that’s good. Generally, the average pass gets completed for more than six yards.
We can account for this on both sides of the ball. Next Gen Stats has an “expected YAC” based on how open a receiver is, how fast they’re traveling, how close defenders are to them, what angle those defenders have, whether or not there’s someone blocking a defender, and distance to the sideline.
Scheme will have a big influence on those factors. So we can use “expected YAC” to isolate how good an offensive coordinator or quarterback is at finding YAC opportunities and can use YAC over expected to isolate a receiving corps’ skill in generating additional yards.
There’s seemingly little question that the 49ers are the best YAC team in the NFL. Not only do they scheme an extraordinary amount of YAC opportunities, but the individual players make the most of them.
While the average team forces one missed tackle for every seven receptions, the 49ers force one every four. This has been true across quarterbacks and is a testament to how well Kyle Shanahan knows how to manipulate defenses.
The Eagles force teams to try and generate YAC opportunities, and though that usually works out for them — they rank first in yards per dropback and third in EPA allowed per play — they’re not a particularly special team when it comes to stopping yards after the catch. When accounting for all of the factors involved in YAC production, they’re essentially average at stopping YAC.
49ers’ Running Offense vs. Eagles’ Running Defense
Mobile Users: Table best viewed in landscape. Use fingers to scroll.
The 49ers are not quite as good as the Eagles are at running the ball, but Philadelphia is substantially worse at stopping the run. There’s an open question about whether or not that will hold up when the Eagles run the ball because the element of a running quarterback throws a wrench into the works. But at a base level, San Francisco has an advantage here.
If the running game substantially affects outcomes — an open question in the analytics community — then Philadelphia has a bit of a problem here. It’s not an enormous problem, all weaknesses are relative, but at the highest levels of play, which is what this is, it can create marginal edges for other teams.
The yards-per-carry number looks bad, as does the tackle-for-loss number, but the Eagles are closer to average than they are to bad. They ranked 22nd in EPA given up per play and 19th in success rate. While teams are getting yards rushing on the ground, they often aren’t beneficial yards.
Still, with all that taken into account, it’s not an impressive performance.
What’s more alarming is that the 49ers have improved in a big way since acquiring McCaffrey. Since their bye in Week 9, when McCaffrey had more time to take in the playbook and pick up a larger role in the offense, San Francisco has ranked seventh in yards per carry, eighth in success rate, fifth in EPA per carry, fifth in explosiveness rate, third in fumble rate, and second in DVOA — all improvements.
The only areas where the 49ers have gotten worse is in first-down rate and tackle-for-loss rate. That’s likely because of McCaffrey’s running style, which prioritizes patience in picking running lanes. It produces more explosive runs and yards on average but does take on some risk in the process.
Not only that, first-down rate on runs is often a product of how often a team reserves its runs for third down. If a team chooses to run more often on first down, their conversion rates drop. While it may be less efficient to choose runs on first downs over passes, EPA accounts for that, and the 49ers’ EPA has gone up.
As they’ve leaned away from their quarterback and towards their running back, San Francisco’s become a surprisingly more efficient offense. In that time, they rank third in offensive EPA per play despite the increased rush rate.
It’s not all gloom and doom on this front. The Eagles have improved on their run defense over time too, especially since Jordan Davis’ return from injury. Since Week 13 and his return to the lineup, they’ve ranked 21st in yards per carry, fifth in defensive rush success rate, 20th in tackle-for-loss rate, eighth in EPA per snap, 13th in first-down rate, and eighth in rush-defense DVOA.
The only two places where the Eagles have stepped back is in explosive rush rate (23rd) and fumble rate (12th). While still giving up the occasional explosive run, Philadelphia’s rush defense has firmed up, as they’ve increased Davis’ role in the defense while supplementing him with Ndamukong Suh and Linval Joseph.
That substantial improvement might be why this is a closer contest than one might imagine, given the season-long numbers and those since McCaffrey started taking on a big role in the offense.
This might be the most closely matched pair of Conference Championship games in recent memory. Given the unique features of each offense and defense involved in both matchups, it should mean some incredible games.
[ad_2]
Source link


[ad_1]
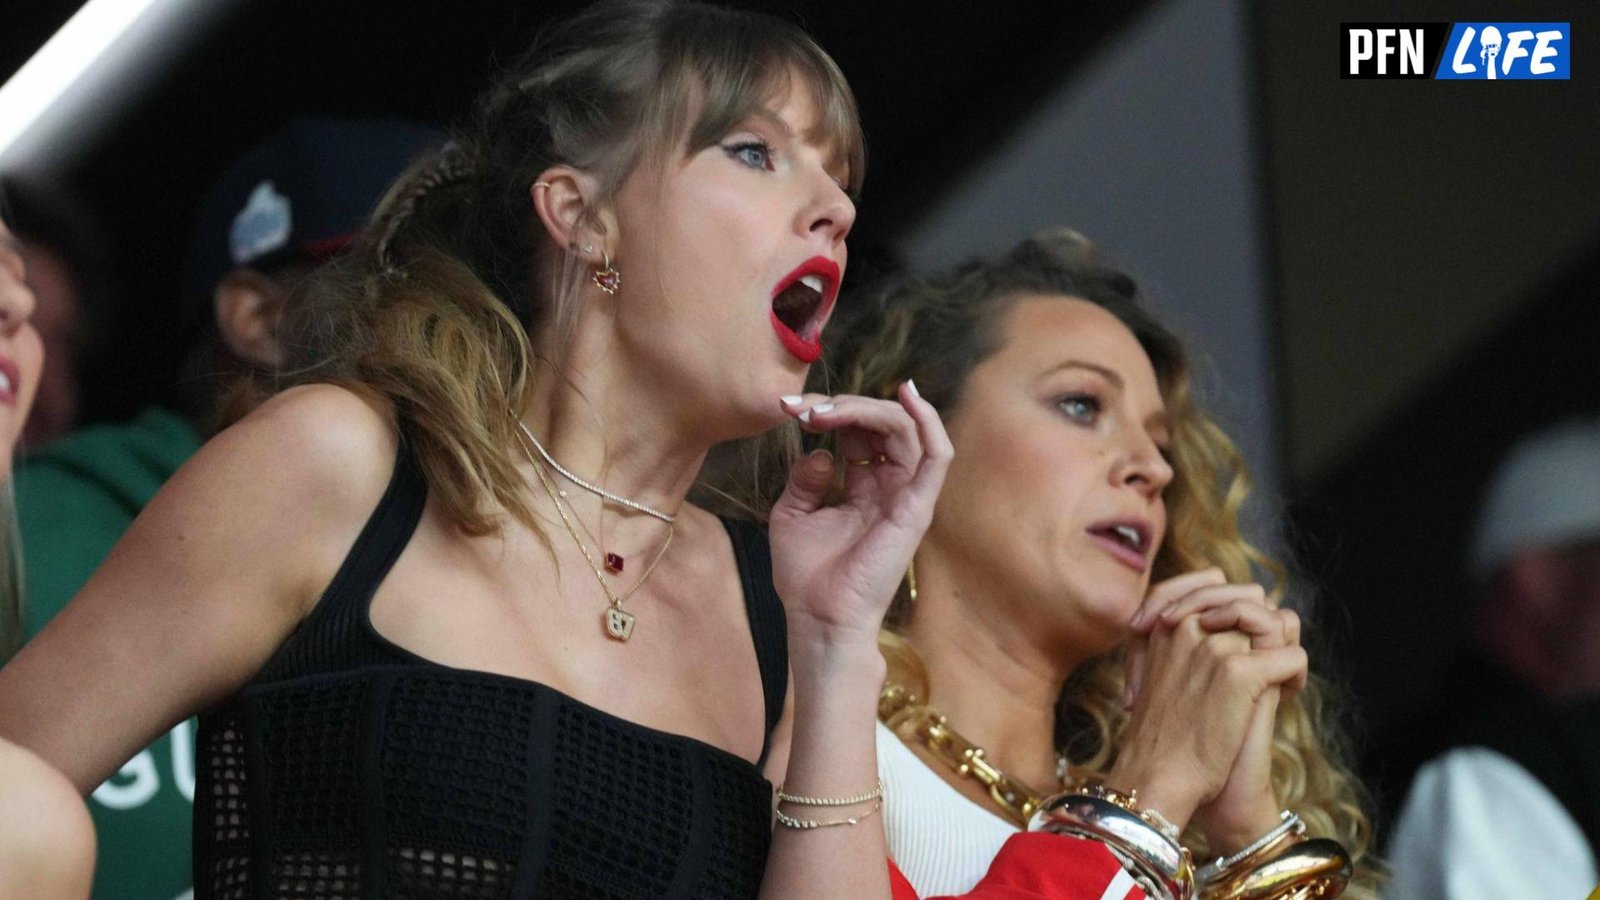
Global superstar Taylor Swift made it to the big game to support her boyfriend, Kansas City Chiefs star tight end Travis Kelce. In the second quarter, it was evident that she was having a good time at the Super Bowl after taking a 12-hour flight from Tokyo the night prior.
Taylor Swift Seen Chugging Beer at Super Bowl
Swift’s attendance has been highly anticipated, as many fans questioned whether she would be able to make it to the big game since she had been in Japan until Saturday for her Eras Tour.
Sure enough, she made it to the Super Bowl and was seen making a grand entrance alongside Blake Lively and Ice Spice.
Swift made it back to the States with plenty of time to make it to Allegiant Stadium to support Kelce. After a leg of her Eras Tour, where she performed several nights in Japan, the singer appeared to let loose.
In a box full of friends, Swift was shown chugging a beer with Ashley Avignone. She was shown on the jumbotron and slammed her cup down after she finished her beer.
Legend 😂 pic.twitter.com/hk27JTAXZ9
— Pro Football Network (@PFN365) February 12, 2024
There was a mix of cheers and boos as Swift was shown on the big screen, and a long pass to Mecole Hardman was the only highlight of the first half for Swift and her friends. The 49ers led the Chiefs, 10-0, late in the second quarter.
On social media, Swift garnered plenty of support from NFL fans.
“If you’re hating on her you can kick rocks man she’s the best,” one user posted on X.
“The one thing I learned this season is that she is actually fun,” another said.
“Booing Taylor Swift chugging a beer is so soft. She’s just one of us now and I respect it ,” another posted.
At the time of the beer chugging, Kelce, Taylor Swift’s boyfriend, has had one catch for a single yard. It came on the first possession, which ended up being a three-and-out. The Kansas City Chiefs hadn’t done much otherwise.
They did have a deep pass play to Hardman, which put them in the red zone, but Isiah Pacheco fumbled on the very next play — one that Kelce was surprisingly on the sideline for.
Swift and Kelce have garnered much media attention as their romance has taken off throughout this NFL season.
Swift was able to support her boyfriend at many of his games throughout the final stretch of the season, as her Eras Tour was on a break. But starting on Feb. 7, she went back on the road.
MORE: NFL World Reacts to Unbelievable Super Bowl Trick Play
Despite performing in Tokyo the night before the Super Bowl, she was able to make it in time to support her boyfriend due to the time difference and is having a good time doing so.
As the 2023 NFL season comes to a close, the 2024 NFL Draft is on the horizon. Pro Football Network has you covered with everything from team draft needs to the Top 100 prospects available. Plus, fire up PFN’s Mock Draft Simulator to put yourself in the general manager’s seat and make all the calls!
Listen to the PFN Fantasy Podcast
Listen to the PFN Fantasy Podcast! Click the embedded player below to listen, or you can find the PFN Fantasy Podcast on iTunes, Spotify, and all major podcast platforms. Be sure to subscribe and leave us a five-star review! Rather watch instead? Check out the PFN Fantasy Podcast on our Fantasy YouTube channel.
[ad_2]
Source link

[ad_1]
The San Francisco 49ers sustained a massive blow during the second quarter of Super Bowl 58, as linebacker Dre Greenlaw left the game on a medical cart.
CBS Sports confirmed that the veteran Greenlaw suffered an Achilles tear, ruling him out for the rest of the game against the Kansas City Chiefs.
What Happened to Dre Greenlaw?
The outside linebacker, who had already been battling past injuries to his hamstrings and calves, left with what appeared to be a leg injury.
And somehow, his left leg looked like it buckled as he tried to trot onto the field with the Niners’ defense.
#49ers LB Dre Greenlaw appeared to suffer an injury while running on the field.
— Pro Football Network (@PFN365) February 12, 2024
Greenlaw clutched his left leg in agony before being helped off the field.
CBS Sports sideline reporter Evan Washburn reported that the outside linebacker left with what was ruled as a lower leg injury. He was later determined to sustain an Achilles injury.
Greenlaw was declared out for the rest of the game.
#49ers LB Dre Greenlaw (Achilles) is now officially out for the game.
— Tom Pelissero (@TomPelissero) February 12, 2024
Greenlaw Carted Off in Passenger Seat
Even more noticeable was where Greenlaw sat on the cart.
He ended up leaving not in the back of the medical vehicle but ended up riding shotgun with his leg injury.
He can’t sit in the back? pic.twitter.com/9jpz0rdoF1
— Big Cat (@BarstoolBigCat) February 12, 2024
One would think that with an injury like an Achilles ailment, medical officials would try to make the player as comfortable as possible before they leave. It wasn’t the case here.
MORE: San Francisco 49ers Depth Chart
Regardless, Greenlaw was replaced by Demetrius Flannigan-Fowles for the rest of the first half. Greenlaw became the most significant injury of the game.
As the 2023 NFL season comes to a close, the 2024 NFL Draft is on the horizon. Pro Football Network has you covered with everything from team draft needs to the Top 100 prospects available. Plus, fire up PFN’s Mock Draft Simulator to put yourself in the general manager’s seat and make all the calls!
Listen to the PFN Fantasy Podcast
Listen to the PFN Fantasy Podcast! Click the embedded player below to listen, or you can find the PFN Fantasy Podcast on iTunes, Spotify, and all major podcast platforms. Be sure to subscribe and leave us a five-star review! Rather watch instead? Check out the PFN Fantasy Podcast on our Fantasy YouTube channel.
[ad_2]
Source link
[ad_1]
Super Bowl 58 is here and it’s going to be exciting. The San Francisco 49ers and Kansas City Chiefs are facing off in the final game of 2023.
CBS is broadcasting the game and the opening was nothing short of amazing. How is the NFL world reacting to the electric Super Bowl-opening video?
Epic CBS Super Bowl Intro Garners Reaction From NFL World
The video, which spanned four minutes and 19 seconds, featured players from both teams talking about the big game and what it means to them. It also featured their families talking about their journeys to this point.
“Amazing intro! Reminds me of my dad! Bravo on the intro!,” one NFL fan said on X (formerly known as Twitter)
And now, the end is near.
And so, the @49ers and @Chiefs face that final curtain. pic.twitter.com/YgIEGOAMb1
— CBS Sports (@CBSSports) February 11, 2024
Additionally, Frank Sinatra’s “My Way” played in the background, giving it a near-movie feel. “This was incredible.,” another person said on X. “And so, the @49ers and @Chiefs face that final curtain,” CBS Sports said.
The 49ers finished the regular season as the top seed in the NFC with a 12-5 record. After their first-round bye, they defeated both the Green Bay Packers and Detroit Lions to earn their trip to Las Vegas for the Super Bowl. Both of their victories came in comeback fashion, including an NFC Championship-record 17-point comeback.
The Chiefs, on the other hand, had a more uphill battle. Entering the playoffs as the AFC’s third seed, they finished the regular season with an 11-6 record. In the playoffs, they defeated the Miami Dolphins, Buffalo Bills, and Baltimore Ravens to punch their ticket.
Super Bowl 58 is a re-match of Super Bowl 54 when the Chiefs defeated the 49ers 31-24. The win was the first in Patrick Mahomes career, as he also won Super Bowl MVP. Four years later, the Chiefs have made three more and won another. For the 49ers, this is their first trip back to the big game since.
The game kicked off at 6:30 p.m. ET with the 49ers receiving the opening kick. In addition to being broadcast on CBS, the game is also being streamed on Paramount+.
As the 2023 NFL season comes to a close, the 2024 NFL Draft is on the horizon. Pro Football Network has you covered with everything from team draft needs to the Top 100 prospects available. Plus, fire up PFN’s Mock Draft Simulator to put yourself in the general manager’s seat and make all the calls!
Listen to the PFN Fantasy Podcast
Listen to the PFN Fantasy Podcast! Click the embedded player below to listen, or you can find the PFN Fantasy Podcast on iTunes, Spotify, and all major podcast platforms. Be sure to subscribe and leave us a five-star review! Rather watch instead? Check out the PFN Fantasy Podcast on our Fantasy YouTube channel.
[ad_2]
Source link

Blake Griffin Announces Retirement After 15-Year NBA Career

How much MONEY will fighters make at UFC 300?

UFC 4 | Khabib Nurmagomedov vs. Yuriy Boyko Ea Sports Ufc 4 Epic Fight

Draymond Green hates the Play-in because ‘it’s the best thing’ the NBA created

Watch moment UFC boss Dana White CONFIRMS Conor McGregor’s return against Michael Chandler as p…

LaMelo Ball might consider wearing ankle braces to avoid future injuries

UFC 4 | Khabib Nurmagomedov vs. Strong Cat Ea Sports Ufc 4 Epic Fight

Grayson Allen Signs 4-Year, $70M Contract Extension With Suns

Bobby Lashley & The Street Profits vs. Final Testament: WrestleMania XL Sunday highlights

AND STILL❗FIRST ROUND KNOCKOUT❗Miel Fajardo Knockouts Highlights

The Ouch List: Week Nine • D1Baseball

UFC 300 Pre-Fight, Pereira vs Hill, Oliveira vs Tsarukyan – Live Stream

Mystery Meat! – The Schoch Factor Podcast • D1Baseball

Trae Young expected to play ‘normal’ amount of minutes in Play-in clash

Charles Olivera's Top 5 Masterful Finishes

Who are the best wide receivers still available late on Day 2?

AFC dominates post-Super Bowl list

BREAKING : Khamzat vs Gilbert Burns UFC 273 | Usman Vs Edwards UFC 272

Los Angeles Rams salary cap situation heading into 2022

Could the Chiefs, Jets, Colts, or Patriots make a run at the former standout?

DOWNLOAD Game MotoGP 2021 Terbaru Ukuran Kecil Update PPSSPP Android

Download MotoGP 2021/2022 Ppsspp Android Offline

Another Long Beach Triumph Headlines Action • D1Baseball

With So Much to Lose, Will Emma Raducanu Be Able to Handle Life at the Top?

Liburan Terbaru Ariel NOAH & BCL Di Pantai Bulukumba Sulawesi Selatan…

Five blockbuster trades that need to happen this offseason

College Baseball Top 10 Plays: Week 5 • D1Baseball

Is Zac Efron Ready to Be a Dad?

RELEASE!!! MotoGP21 Android | SBK 09 Mod MotoGP 2021 PPSSPP

Jadwal MotoGP 2022 Live Trans7 ~ Jadwal Lengkap Siaran Langsung MotoGP 2022 ~ MotoGP Indonesia
-
 NFL2 years ago
Who are the best wide receivers still available late on Day 2?
-
 NFL2 years ago
AFC dominates post-Super Bowl list
-
 UFC2 years ago
BREAKING : Khamzat vs Gilbert Burns UFC 273 | Usman Vs Edwards UFC 272
-
 NFL2 years ago
Los Angeles Rams salary cap situation heading into 2022
-
 NFL2 years ago
Could the Chiefs, Jets, Colts, or Patriots make a run at the former standout?
-
 Moto Gp2 years ago
DOWNLOAD Game MotoGP 2021 Terbaru Ukuran Kecil Update PPSSPP Android
-
 Moto Gp2 years ago
Download MotoGP 2021/2022 Ppsspp Android Offline
-
 Baseball2 years ago
Another Long Beach Triumph Headlines Action • D1Baseball